.png)
August 22, 2025
Efficiency travels. Talent graduates. And that's why the same names keep showing up in the playoff race. They reload--not rebuild.
Every offseason, one of the loudest talking points is returning usage. Analysts and fans alike want to know: how much production is coming back from last year’s roster? The assumption is simple--the more you bring back, the better you’ll be.
But when you actually line up returning usage against efficiency from the previous season, the correlation isn’t nearly as strong as you’d expect.
.png)
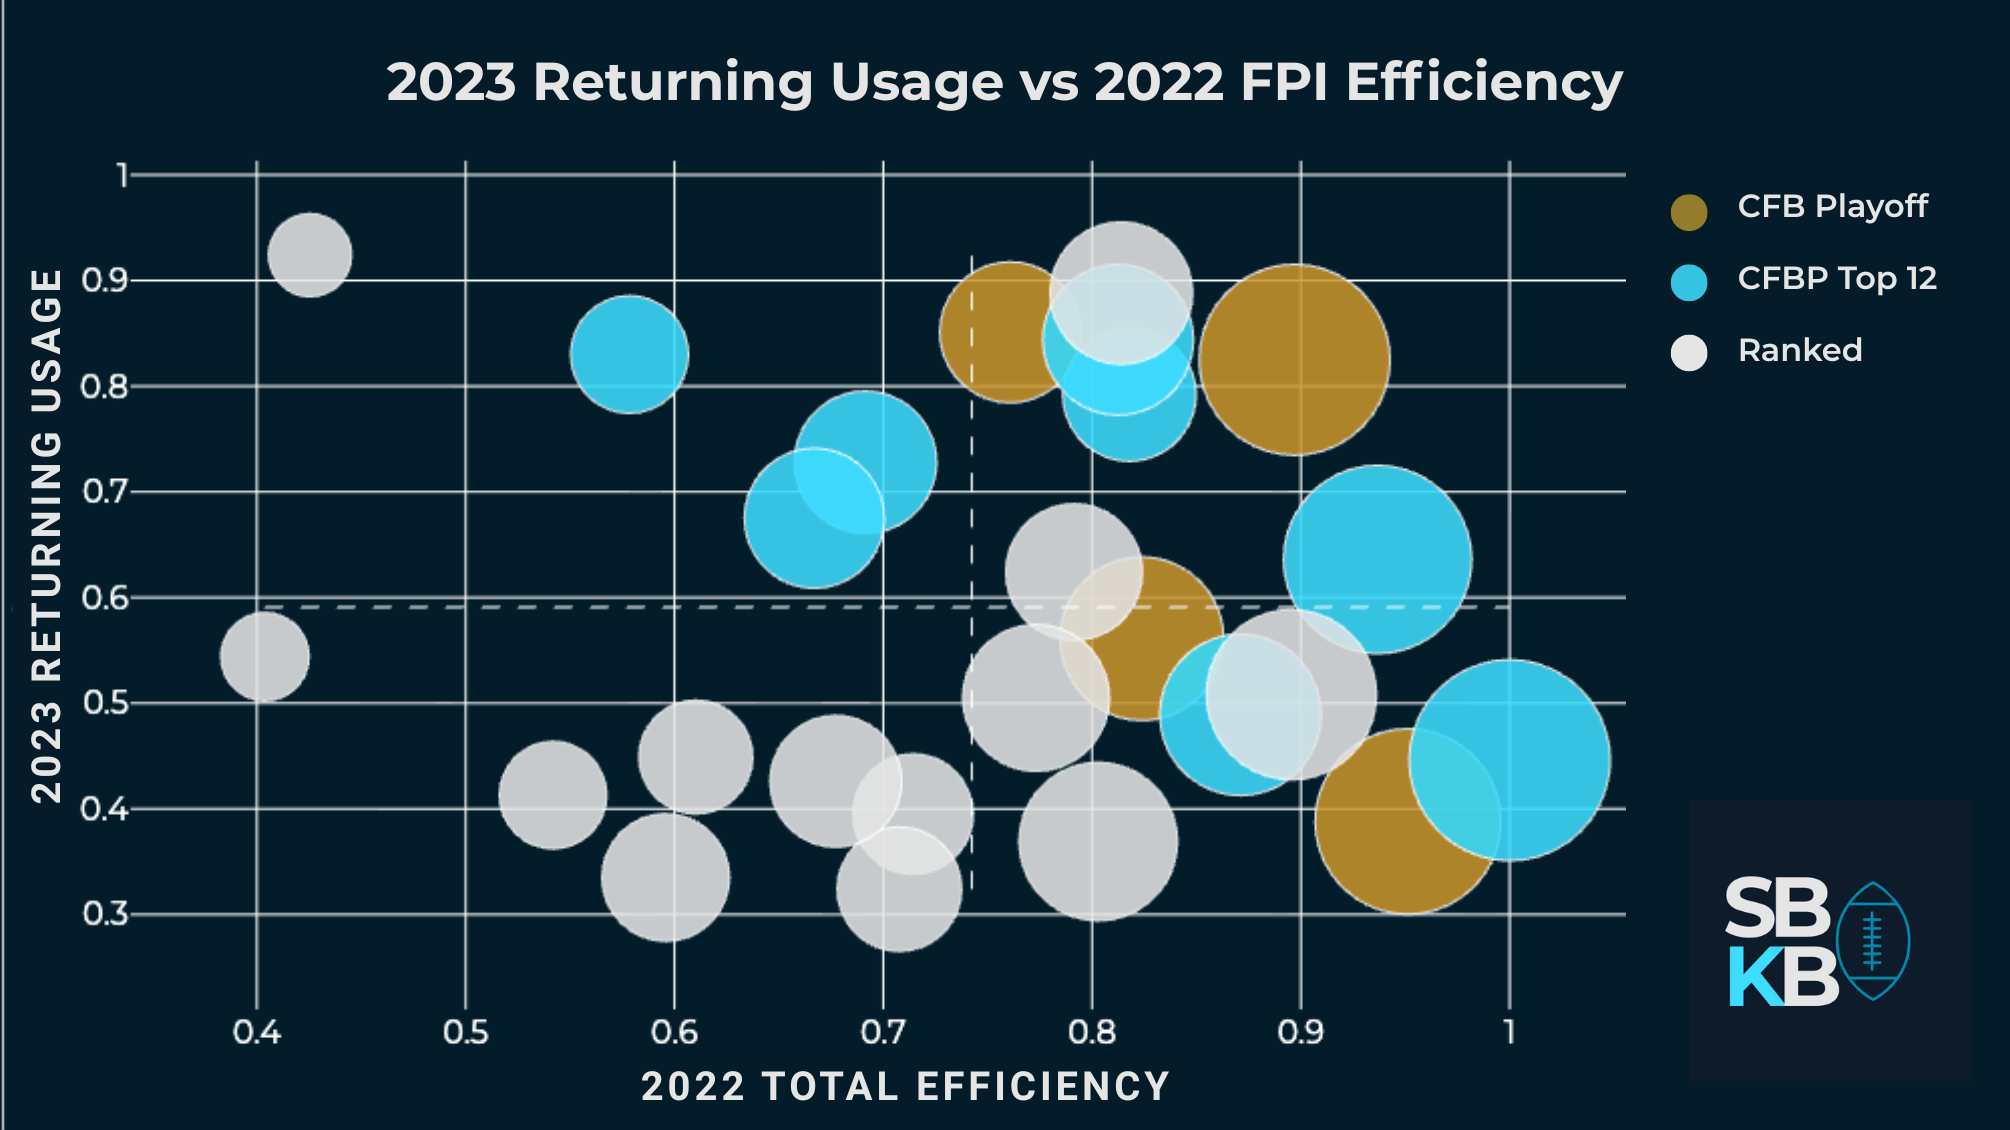
Looking specifically at the College Football Playoff, the data doesn’t back up the idea that you need sky-high returning usage to make it. In fact, over the last two seasons, if you take the median average of returning usage among College Football Playoff Teams (Field of 12 in 2024 and Top 12 Ranked in 2023, for continuity), the split just slightly favors higher usage. Looking at the final four teams specifically, it's an even split at 4-4.
Translation: having more guys back doesn’t guarantee you’re getting in, and having fewer doesn’t guarantee you’re staying out.
In 2023, the Michigan Wolverines had one of the highest returning usage rates amongst Top 12 teams at 82.5%, paired with a previous season's efficiency in the top ten percent. Of course, as we know, they went on to beat Alabama and Washington, earning themselves a National Championship. But, that same year, Alabama had a 38.8% returning usage rate and took those same Wolverines to overtime in the Rose Bowl, ultimately losing by just a single score.
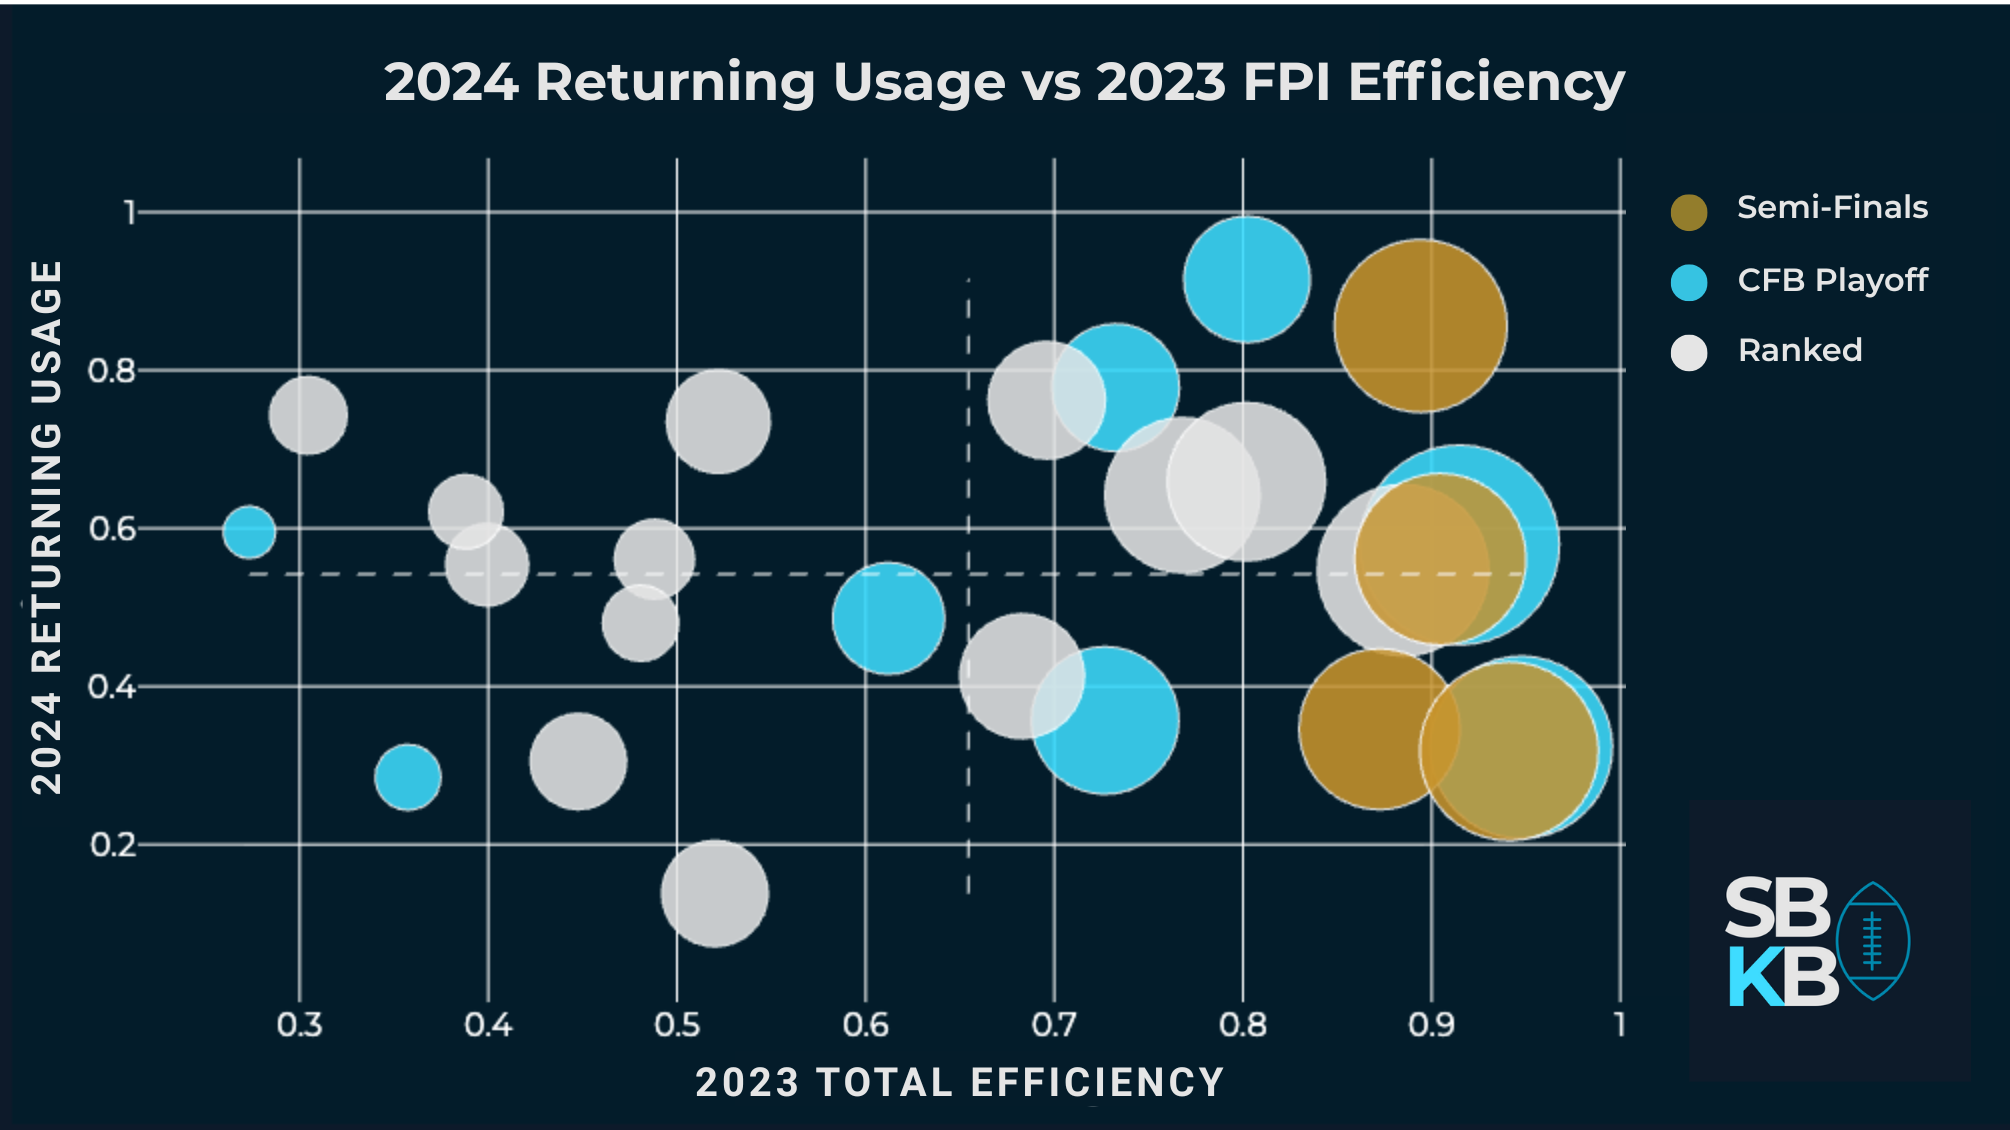
Skip ahead to the 2024 season and we see a similar picture. Penn State boasted the highest returning usage amongst semi-final teams, followed by Texas, and neither played for a National Championship this past January. Instead, the teams who did--Ohio State and Notre Dame. Who had the fourth and sixth lowest returning usage numbers across all of the teams we analyzed.
The fact that elite programs remain so efficient isn’t just by chance--and it isn’t only about the talent on the field. It’s the culture and program identity that have been built over time. This is the pattern with Georgia, Michigan, Ohio State, and the other perennial contenders: systems, development, and culture keep the machine running no matter who leaves.
Of course, returning usage isn’t meaningless. It can still give teams a bump. We’ve seen programs with middling efficiency one year turn the corner the next because they returned experience and continuity. If you compare a team like Penn State or Clemson in 2023 to 2024, both had middling returning usage and slightly above average efficiencies in the 2023 graphic. But both jump into the upper-right quadrant for 2024.
Clearly, if everything I have said proves anything, it's that returning usage is not the end-all-be-all metric for predicting future success. But, it's still a piece of the puzzle. As is maintaining a program that boasts strong efficiency ratings year to year. So, to give us that one puzzle piece before Week 0 kicks off tomorrow, we overlayed this year's AP Top 25 against a heat map of previous CFBP success from the 2023-2024 seasons.
.png)
I'll return to this chart in some additional season previews over the next week, but my biggest takeaway for now? We see two of the four teams in the upper right quadrant face off in just 8 days when Clemson plays host to LSU in what should be an incredible event. Happy College Football Season--we made it, folks.